tes-ds-club
Iris dataset fact sheet
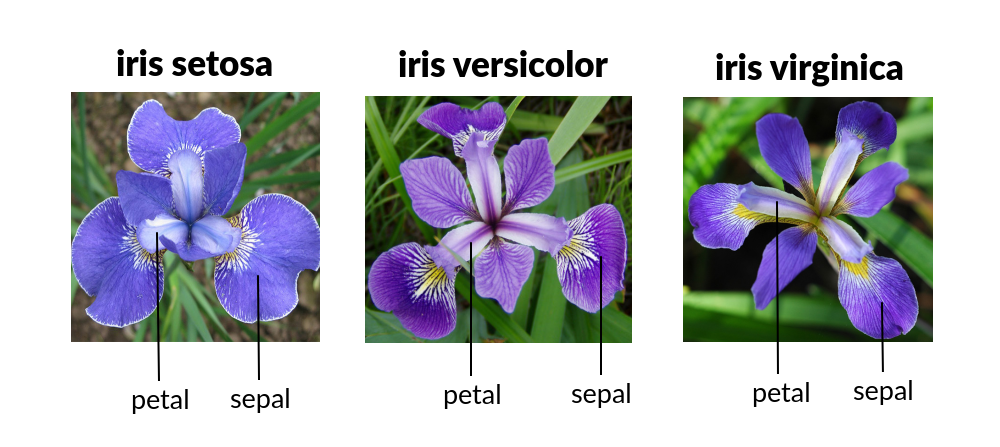
“Iris” is one of the earliest datasets used to study classification. It was made famous by the British statistician and biologist Ronald Fisher in his 1936 paper The use of multiple measurements in taxonomic problems. The dataset describes examples of three species of iris flowers, and for each example it lists four measurements of the shape of the flower. The measurements are called “sepal length,” “sepal width,” “petal length,” and “petal width.” All of the measurements are in centimeters.
This is a small sample of the data in the iris dataset. Each row corresponds to an individual flower. Each column corresponds to a measurement. The last column is the “label,” which is the true species of the flower.
| Sepal Length | Sepal Width | Petal Length | Petal Width | Label |
|---|---|---|---|---|
| 5.4 | 3.4 | 1.7 | 0.2 | Iris-setosa |
| 5.0 | 2.0 | 3.5 | 1.0 | Iris-versicolor |
| 5.8 | 2.7 | 4.1 | 1.0 | Iris-versicolor |
| 6.2 | 2.8 | 4.8 | 1.8 | Iris-virginica |
| 5.9 | 3.0 | 5.1 | 1.8 | Iris-virginica |
How can we use these four measurements to tell these species apart?